Patient Satisfaction Survey
Summary of responses to Patient Satisfaction Survey conducted between October and December 2020
The Diagnostic Endoscopy Centre conducted an annual audit of patients who attended our facility between October and December; to seek feedback from our patients and their carers. We used an external service (QPS Benchmarking) to prepare the survey and the results are benchmarked against our previous results and those of our peers. The audit was conducted across a broad range of criteria. We use the outcomes of feedback to help refine our staff education programs. The results are also used to validate our performance for accreditation purposes.
During October to December 2020, we admitted 1922 patients. We received 334 completed surveys. Participation in this survey is voluntary and not all patients were given a survey to complete. Patients had the option to identify themselves if they wished. It is especially beneficial to us where respondents chose to identify themselves as it aids us in responding to any queries or comments they have identified.
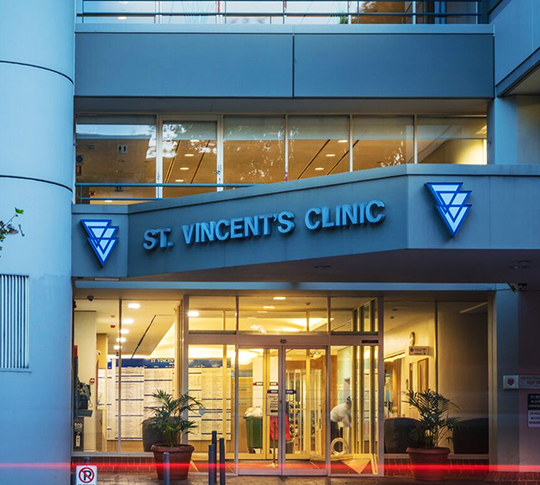
Respondents were asked to provide some personal details about themselves prior to starting the survey. These included their name, age, postcode, gender, language spoken at home, where they are from (indigenous background) (specified), their general health, financial status, health fund name (if applicable) and who referred them to the DEC.
From their responses we have the following information:
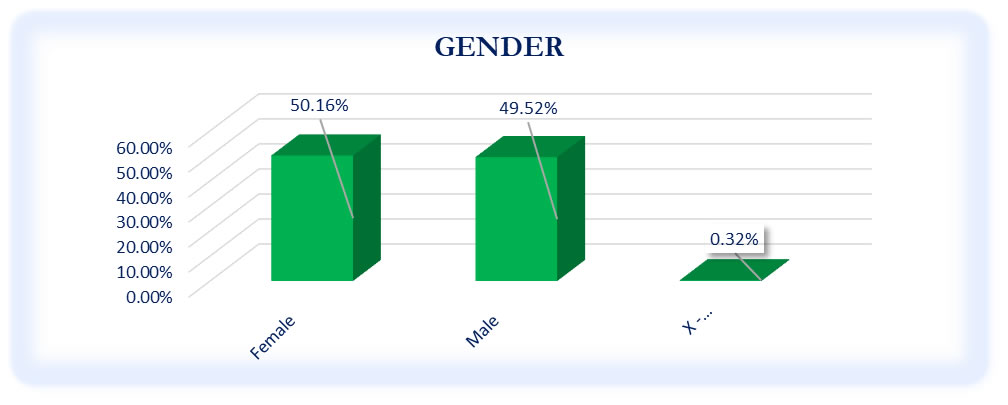
Gender of Respondents
50.2% of respondents were female (more females responded to the survey last year than men – this has been repeated for the past three years)
49.5% were male
0.3% of respondents did not specify their gender
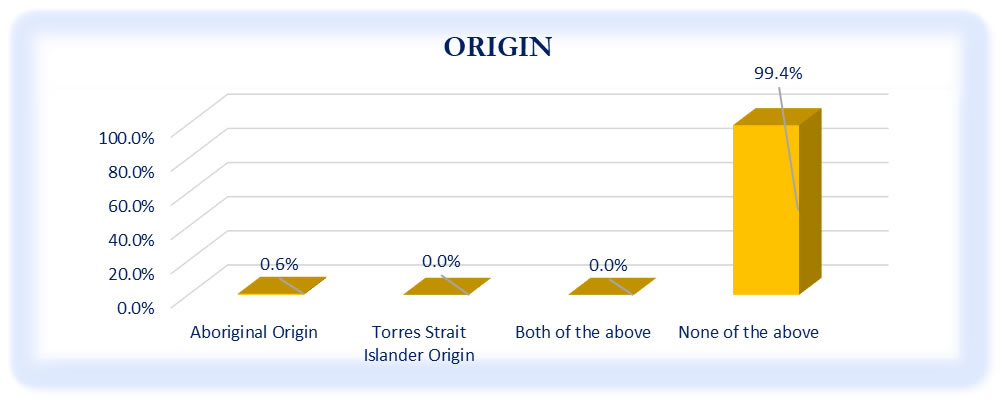
Origin of Respondents
99.4% of respondents were not Aboriginal or Torres Strait Islander descendants
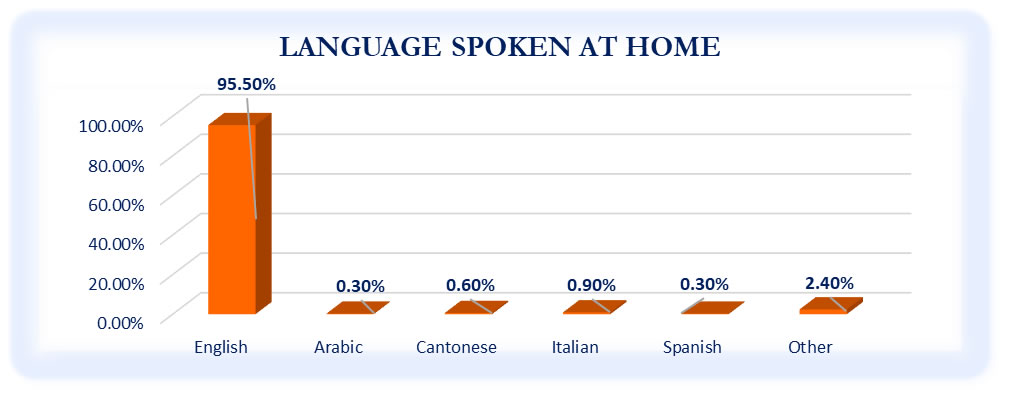
Language Spoken at Home
95.5% of respondents speak English as their first language at home
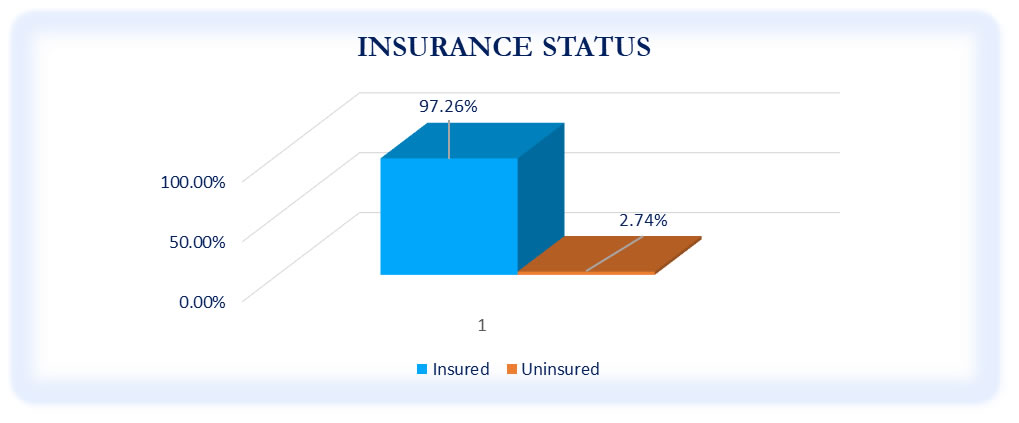
Insurance Status
97.3% of respondents are privately insured
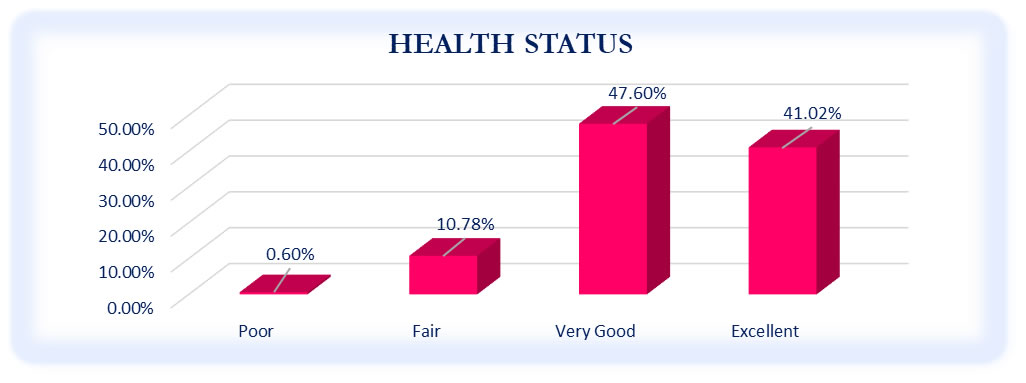
Health Status
41% of respondents identified their health status as excellent
47.6% of respondents identified their health status as very good
10.8% of respondents identified their health status as fair
0.6% of respondents identified their health status as poor
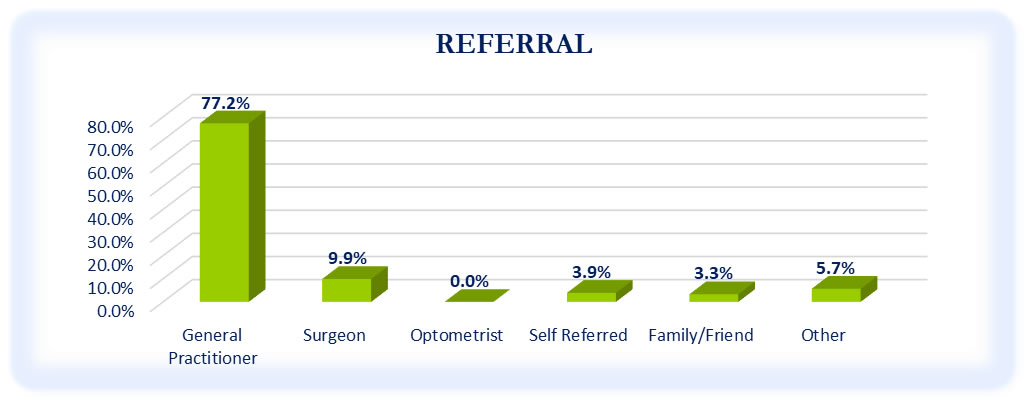
Source of Referral
77.2% of respondents were referred by their GP
9.9% of respondents were referred by their surgeon
3.9% of respondents were self-referred
3.3% of respondents were referred by family or friends
5.7% of respondents were referred by from other sources
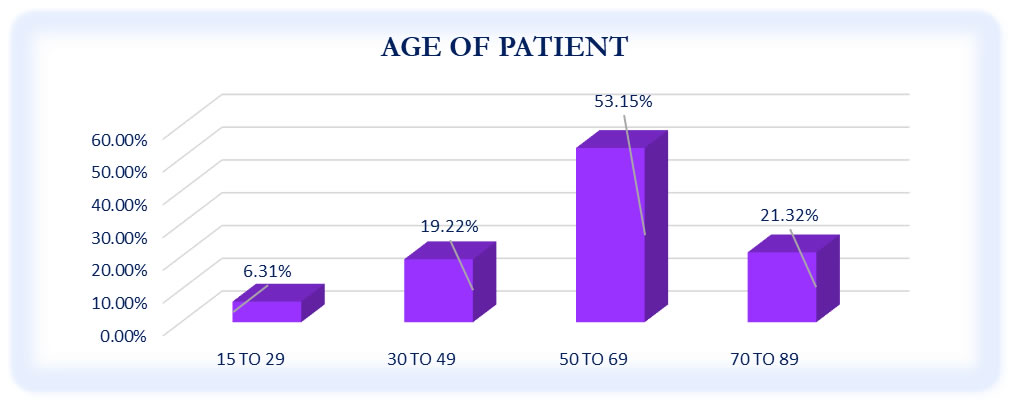
Age of Patient
6.3% of respondents were aged between 15-29 years
19.2% of respondents were aged between 30-49 years
53.2% of respondents were aged between 50-69 years
21.3% of respondents were aged between 70-89 years
Breakdown of membership
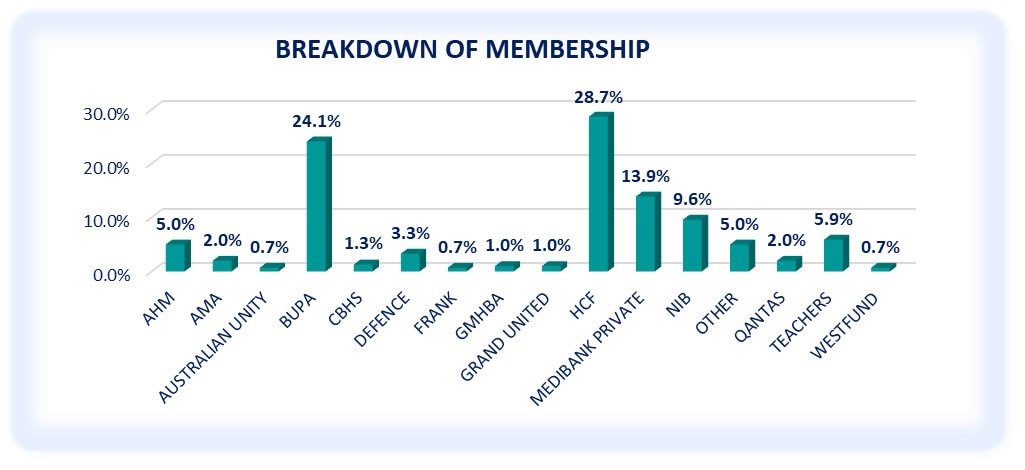
We noted 97.26% of the respondents are members of private health funds with the remaining respondents being uninsured. This is a summary of the health funds identified by respondents (in alphabetical order):
AHM 15 (5%)
AMA 6 (2%)
Australian Unity 2 (0.7%)
BUPA 73 (24.1%)
CBHS 4 (1.3%)
Defence 10 (3.3%)
Frank 2 (0.7%)
GMHBA 3 (1%)
Grand United 3 (1%)
HCF 87 (28.7%)
Medibank Private 42 (13.9%)
nib 29 (9.6%)
Other 15 (5%)
QANTAS 6 (2%)
Teachers 18 (5.9%)
Westfund 2 (0.7%)
Survey Categories
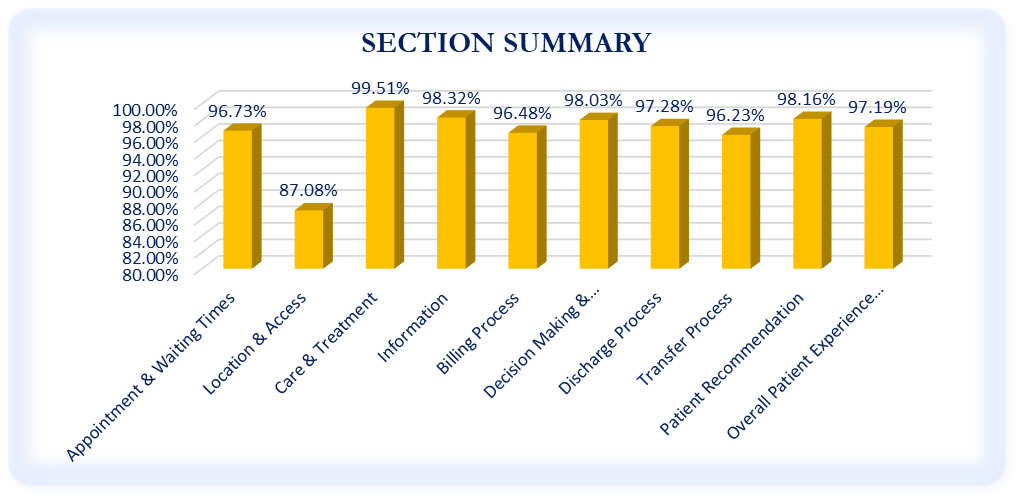
Nine categories were surveyed with the following percentage scores:
Patient experience with appointment and waiting time 96.7%
Patient experience with location and physical access 87.1%
Patient experience with care services and treatment 99.5%
Patient experience with information 98.3%
Patient experience with the billing process 96.5%
Patient experience with decision making & involvement 98.1%
Patient experience with discharge process 97.3%
Patient experience with transfer process 96.2%
Patient recommendation 98.2%
Overall patient experience index 97.2%
The category of location and physical access remains a challenge against the other categories. The DEC is located in the very busy St Vincent’s Clinic building and car parking is always in high demand. There appears no real solution to this issue – availability of car parking scored 75.6% the same result as last year’s survey, and 67.24% in 2018.
Appointment and waiting time
The information made available to me to prepare for my appointment 98%
The way I was treated on the phone 97.7%
The overall waiting time I experienced 94.5%
Location and physical access
Availability of drop off areas 85.7%
Availability of car parking 75.7%
Providing me with information on location and public transport 92.7%
Inside and outside signs at the DEC 89.2%
Disability access 94.6%


Care services and treatment
Treating me with respect and dignity during my stay 99.8%
My views and concerns were listened to 99.7%
My individual needs were met 99.5%
When a need could not be met, staff explained why 99.8%
If I needed assistance, staff helping me within a reasonable timeframe 99.4%
The staff caring for me, explained things in a way I could understand 99.8%
The staff were able to allay any worries or fears I had 99.7%
I felt cared for 99.8%
The staff involved in my care, communicated with each other about my treatment 99.4%
I received pain relief that met my needs 99.4%
When I was in hospital, I felt confident in the safety of my treatment 99.6%
The overall cleanliness of the DEC 98.3%
The overall care I received whilst at the DEC 99.6%
Information
Rights and responsibilities in a way that was easy to understand and helpful 98.3%
I was kept informed as much as I wanted to be about my treatment 99.1%
My family or carer were kept informed as much as I wanted 98.6%
The information about my consent was easy to understand and helpful 98.9%
Enough information about the prevention of infections 97.8%
Which best describes your experience of the overall information 97.3%
Billing process
Providing advice/information on the cost of my procedure before admission 96.6%
Information about my financial consent was easy to understand/helpful 96.4%
Decision making and involvement
Being involved, as much as I want, in decisions about my care/treatment 98.2%
Having enough opportunities for carer/family to talk to staff 97.2%
Allowing my carer/family to be involved in my care as much as I wanted 98.6%
Discharge process
Making adequate arrangement for services I needed following my discharge 97.3%
Providing enough information about how to manage my care at home 97.3%
Providing enough information about how to manage my medicines at home 97.8%
Providing instructions for any follow up appointments after my procedure 97.0%
Emergency medical care information including phone number 97.2%


Transfer process
Being provided with enough information about the reason for my transfer 96.7%
Notifying my carer or relative about my transfer 97.5%
Involving me and my carer in all parts of my transfer as much as possible 96.3%
Making my transfer as easy and comfortable as possible 94.7%
Patient recommendation
How likely would you be to return if require a procedure in future 98.2%
How likely to recommend care, treatment to family and friends 98.2%
Overall patient satisfaction
The DEC achieved an overall satisfaction score of 97.2%.
The summary of this survey is published on our website; distributed to our contracted health funds, and copies provided in recovery for our patients and carers to read.
Once again, we would like to thank those patients and carers who took the time to complete this survey. The survey is seven pages long and takes a considerable amount of time to complete. We thank you for the time away for your other interests or responsibilities to help us.
We have a consumer focus group that has helped us refine our documentation and which continues to help us improve the quality of service we provide to you. If you would like to assist us in any way please feel free to contact Laine, our Nursing Unit Manager (laine@endoscopy.stvincents.com.au) or Jan, our Chief Executive Officer (jan@endoscopy.stvincents.com.au) or telephone us on 02 8382 6622. Please feel free to contact us at any time if you would like to discuss your care or the services we have provided to you.

